HSL Curves
With HSL curves you can adjust the color properties of a video by modifying the hue, saturation, and luminance levels. The curve interface provides precise control over these adjustments, allowing to create custom color effects, correct color imbalances, enhance specific hues, or achieve a desired overall color look. By adjusting the HSL curves, you can fine-tune the colors in a video, making it more vibrant, correcting color casts, or achieving a specific mood or style.
Color squares
The six color squares above the curve spectrum represent the three primary colors (Red, Green, and Blue) and the three secondary colors (Yellow, Cyan, and Magenta).
To add a point on the curve for these exact colors:
-
Click the appropriate color square.
-
Click the Gray square to open a color pallet from which you can choose other colors.
When you select a point on the curve, you can check the exact value of both the hue and saturation in the text fields above the spectrum.
Red range
The red range on the horizontal spectrum spans the point at which the spectrum “loops” around to start at the beginning again. This can make it difficult to work with a range that includes reds.
To make it easier to work with the reds:
-
Click the spectrum away from any points or the curve line itself.
-
Drag the spectrum right or left to scroll it over so that the red values are more in the middle of the spectrum view.
-
You can easily create your range and make your red adjustments.
|
|
The Color Selector enables you to easily sample a value or a range of values in the video to which the color curve adjustments will apply. This makes it easy, for example, to target a specific hue or a range of hues that will be affected by the adjustments made with the curve. |
-
Add a video clip to your timeline.
-
Place the cursor within the video event by clicking at the desired position.
-
Click the Color Grading button to open the Color Grading panel.
-
Switch to the HSL Curves tab. The default curve type is Hue vs. Hue.
-
Click the Color Selector button. The mouse icon will change to a Plus symbol, indicating that you are in selector mode.
-
In the Video Preview window, click on a brightly colored object. A point will be added to the color curve at the exact hue you clicked. You can adjust this point to change the color hue to a different hue.
By default, if you have only one point on the curve, any adjustments you make will affect all hues in the video.
Create a hue range to work with:
-
Click the Reset button to return to the default curve shape.
-
Click the Color Selector button again.
-
Instead of just clicking, click and drag to create a rectangle across a range of colors in the Video Preview window.
-
This will create three points on the curve. The outer points define the range of hue values included in your selection, while the middle point represents the mean value of all the colors included in the selection.
-
Adjust the middle point and notice that you are now modifying only the hues within the selected range on the curve.
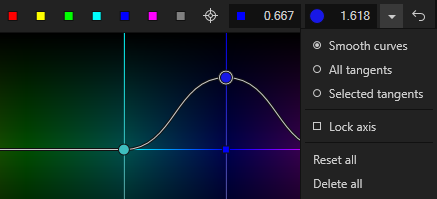
Context menu
A point’s context menu provides additional functionality. Right-click a curve point to access the following options:
| Lock Tangents |
When you choose one of the tangent curve options (see below), this dictates how the curve handles related to each other
|
| Smooth curves |
The curve starts gradually, increases toward the middle, and ends gradually. You cannot modify this behavior. |
| All tangents |
Curve handles appear on all points and enable you to change the shape of the curves. |
| Selected tangents |
Curve handles appear on just the selected point and enable you to change the shape of the curves. |
| Lock axis |
Select this option if you want to restrict the movement of a curve point to vertical only, and thus lock it to a specific hue value horizontally. NOTE You can still move the point horizontally by dragging the vertical hue line instead of the point itself. |
| Reset |
This resets both the curve’s shape (if you’ve used one of the tangent options above) and vertical position. To reset just the point’s shape: Double-click the point. To reset just the point’s vertical position: Double-click the small anchor point on the curve that corresponds to the points horizontal location. |
| Delete |
Deletes the point. You can also click the point with the middle mouse button/wheel to delete it |
Setting the curve to its default
Click the Reset button to remove all points from the line.