Saturation vs. Saturation color curve
*new since VEGAS Pro 20 update 1*
This curve enables the user to define a range of saturation levels in the video and then adjust the saturation level of just that range. This enables the user to control saturation levels that range from the entire video to very targeted areas of the video based on current saturation levels. For example, the user could define a saturation range that includes everything below a level of 150 and remove the saturation from that range so that everything that was originally below 150 would now be completely desaturated.
Using the Saturation curves
-
Add a video file to your timeline.
-
Select the video event and click the Color Grading button to open the Color Grading panel.
-
Click the HSL Curves tab and select Saturation vs. Saturation from the Curve Type drop-down list.
-
The curve background shows a saturation spectrum that starts with fully desaturated at the left and ends with fully saturated on the right. The white horizontal line in the vertical center of the spectrum depicts the curve.
-
Adjust the saturation of the entire video
-
Double-click the curve to add a control point to it.
-
Drag the control point up.
This adds saturation to the entire video.
-
Drag the point down.
This removes saturation.
-
Drag the point fully down.
This completely desaturates the colors in the image so that you end up with a grayscale image with no color.
NOTE When the curve has just one point, it doesn’t matter where you locate that point horizontally—it always adjusts the entire curve which remains flat and thus effects the entire video.
-
-
Manipulate the curve for selective saturation adjustments
-
Add multiple control points to the curve.
-
Reposition a control point to alter the shape of the curve and affect saturation differently at different points.
For example, say you want to target the areas of the video that already have the highest saturation and then adjust that saturation without affecting areas which already have low saturation.
-
Double-click the curve near the horizontal midpoint to add a control point.
-
Double-click toward the end of the curve to add another point.
-
Drag the control point at the end of the curve up and down to observe changes in saturation for different colors.
-
-
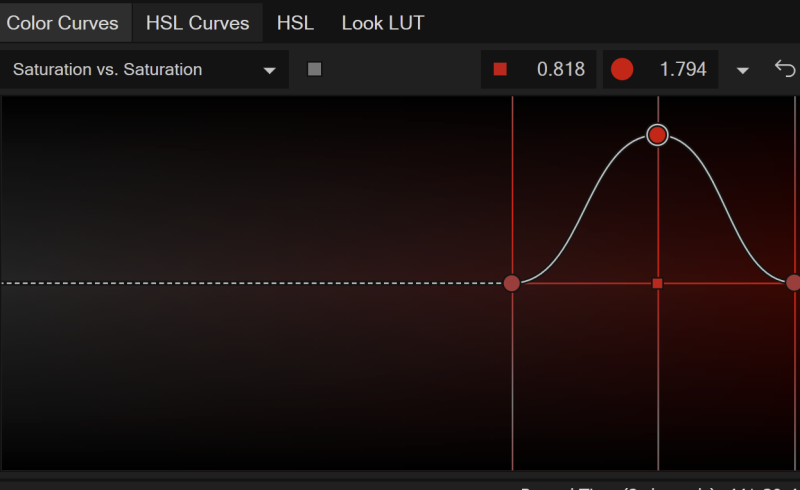
Target a specific saturation range for adjustment
-
Add three points to the curve.
The two points on either side act as anchors that keep the curve flat outside of the range.
-
Drag the middle point up and down.
This alters the saturation of only the range between the two end points and enables you to target your saturation adjustment in a very specific manner.
-
Check saturation values and customize colors
-
When selecting a point on the curve, check the exact vertical and horizontal saturation values in the text fields above the spectrum.
-
To change the saturation color, click the color indicator in front of the value and select a new color from the color chooser.
-
Dark colors have higher saturation, while light colors have lower saturation.