Color Curves
Color Curves let you fine tune brightness, contrast, and color. Use them to correct tones precisely or to shape a creative look.
Open the Color Grading Window and select Color Curves in the left navigation.
The Color Grading window provides four curves: one for Brightness and one each for Red, Green, and Blue. In the default view all curves share a single graph, but only the Brightness curve is visible at first.
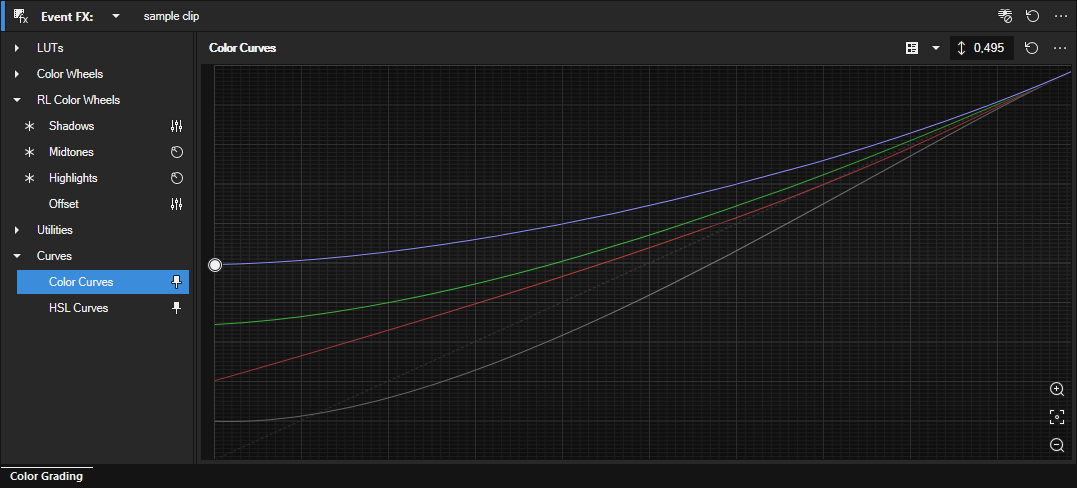
FIGURE Color Curves overview
Navigation and shortcuts
Zoom the view for precision, pan when zoomed, and reset the viewport with a single key.
-
Zoom in or out: use the Zoom buttons or the mouse wheel, or press Num Plus or Num Minus.
-
Reset view: press Num 5.
-
Pan view: press Num 8, Num 6, Num 4, or Num 2.
-
Select next or previous point: press Page Up or Page Down.
These shortcuts help you control curve handles even when they move outside the initial viewport.
Add and edit control points
You can also add additional control points to any curve for even greater control.
-
Add a point: double click the curve.
-
Edit tangents: select a point, then press Shift + Arrow to move the left tangent, or Ctrl + Shift + Arrow to move the right tangent.
-
Unlock tangents: right click a point and clear Lock Tangents to adjust handles independently.
Control points that are not endpoints have two handles you can use to change the shape of the curve.
By default, the tangents on a point are linked, so moving one handle also moves the other. To adjust handles independently, right click the point and clear Lock Tangents.
Use these controls to shape transitions smoothly without moving the point itself.
Adjust shadows and highlights
-
To adjust shadows, drag the control at the left end of the Brightness curve.
-
To adjust highlights, drag the control at the right end.
-
Use the yellow curve handles on each point to change the curve shape without moving the point.
Each color curve behaves in the same way as the Brightness curve.
Activate additional curves
Click the Select Curves button and enable the checkbox for the curves you want. All activated curves appear on the shared graph.
View all curves at once
-
Drag the left border of the Color Curves section to the left.
-
Once expanded far enough, the four curves appear side by side, each on its own graph.
This layout can make comparisons clearer when adjusting multiple channels.
You can pin Curves so they remain visible below other sections while you work.
Last modified on December 08, 2025